3.6K
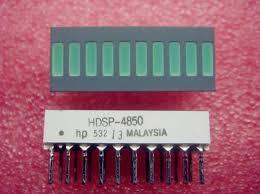
The bar graph is basically a series of LEDs in a line, this is a common hardware display for analog sensors. It’s made up of a series of LEDs in a row, you simply treat these as you would do if you had various LEDs. The example I have is a 10 way green type
Here is a picture of it
hdsp-4850
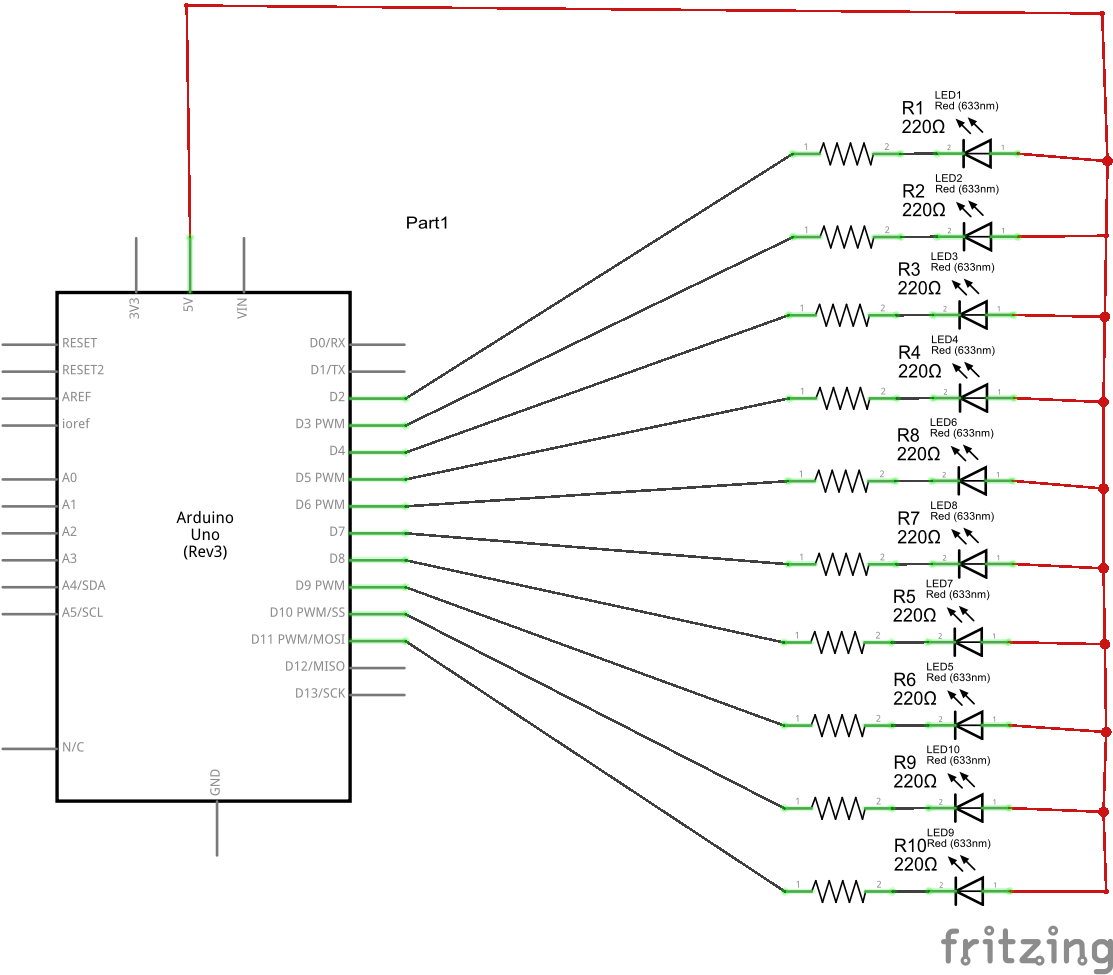
Schematic
Arduino and LED bar graph_schem
Code
There are better ways of doing this but this is a basic example.
[codesyntax lang=”cpp”]
const int ledCount = 10;    // the number of LEDs in the bar graph

int ledPins[] = {
  2, 3, 4, 5, 6, 7, 8, 9, 10, 11
};   // an array of pin numbers to which LEDs are attached


void setup() {
  // loop over the pin array and set them all to output and high
  for (int thisLed = 0; thisLed < ledCount; thisLed++)
  {
    pinMode(ledPins[thisLed], OUTPUT);
    digitalWrite(ledPins[thisLed], HIGH);
  }
}

void loop() {

  // loop over the LED array:
  for (int thisLed = 0; thisLed <= ledCount; thisLed++)
  {
      digitalWrite(ledPins[thisLed], LOW);
      delay(500);
  }

  for (int thisLed = 0; thisLed < ledCount; thisLed++)
  {
    digitalWrite(ledPins[thisLed], HIGH);
    delay(500);
  }


}
[/codesyntax]
